Healthy city
Compact places work best when safe, space-efficient transportation receives the greatest priority.
A curated timeline of federal, state, and local policies that shape walking, transit, cycling, essential access, and cars. Coverage is selective rather than comprehensive.
Healthy city
Compact places work best when safe, space-efficient transportation receives the greatest priority.
Unhealthy city
Car-first planning leaves walking, transit, and cycling with less space, safety, and investment.
Outside cities
Rural and low-density areas need stronger support for longer-distance travel, regional connections, essential services, and private vehicles.
Bar length shows relative planning priority, not a literal budget percentage.
A 15-minute city does not place every destination in every neighborhood. Frequent needs should be close enough that driving is optional, while larger institutions can be farther away and reached by transit, roads, cycling, and accessible services.
Frequent destinations should usually be reachable in about 15 minutes.
Longer bars mean the destination should usually be closer to home.
Travel priority for everyday needs
Cars can still access these places, but routine errands should not depend on driving.
Large or infrequent destinations can serve the whole city or region.
These places can be farther away, but should remain easy to reach across the city or region.
Travel priority for specialized destinations
Longer trips make car access more important, while transit and other connections remain essential.
Everyday trips should favor walking, cycling, and local transit. Longer specialized trips can place greater emphasis on regional transit and car access.
Cities can be understood by how daily life is organized. A walkable city keeps everyday needs close. A transit city connects neighborhoods, jobs, schools, and regional destinations without requiring a car. A bikeable city makes short and medium trips safer, faster, and more affordable. These types can overlap, creating a healthier compact city where people have choices: short trips can be walked, medium trips can be biked, longer trips can use transit, and cars can still exist without controlling daily life. A car-dependent city works differently. When streets, housing, stores, and public space are designed mainly around driving, the city spreads out. That makes walking less useful, biking less safe, and transit harder to run. The diagram below compares these city patterns and shows why the strongest cities are car-optional, not car-dominated.
These charts tell the story of car dependency: volatile fuel costs, public health, street safety, climate pollution, cleaner cars, and smaller alternatives.
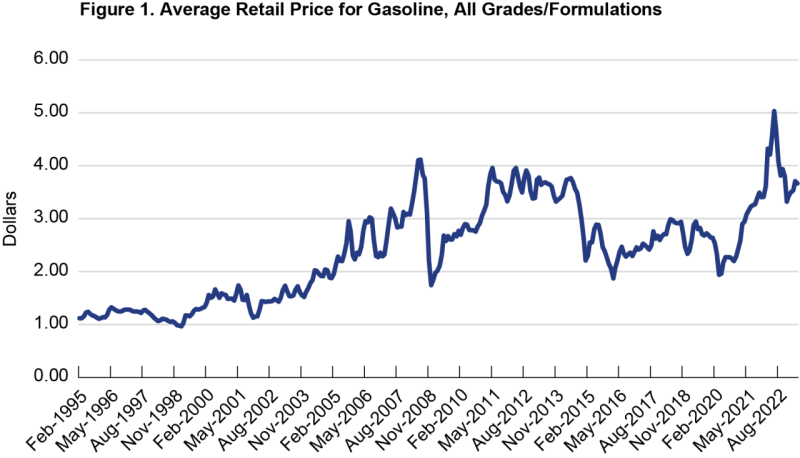
Bureau of Transportation Statistics
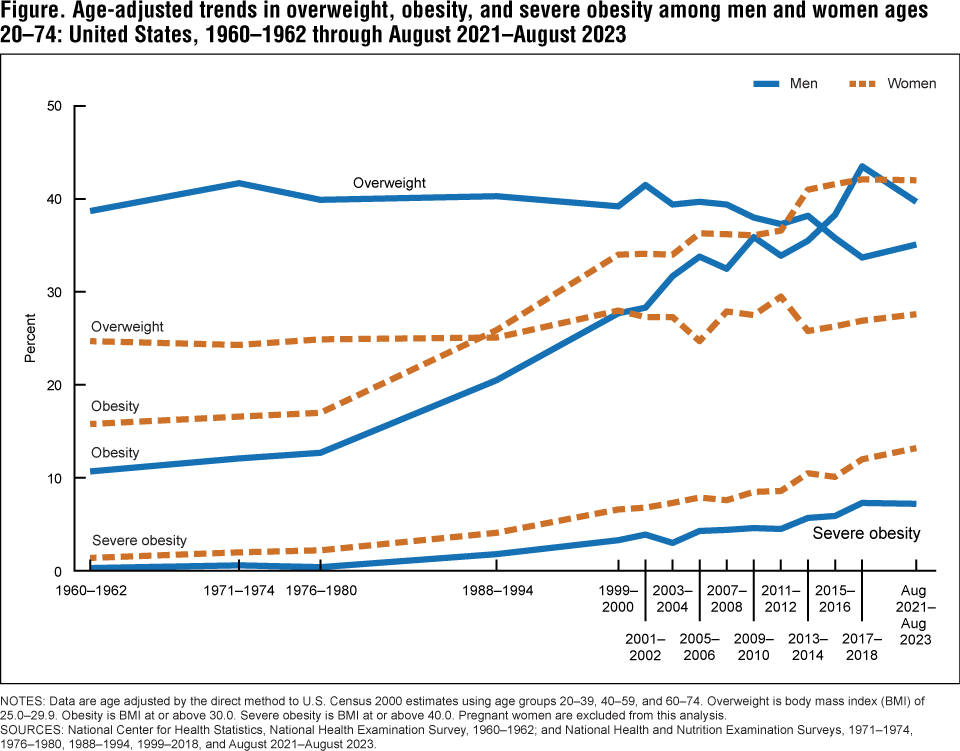
CDC / National Center for Health Statistics
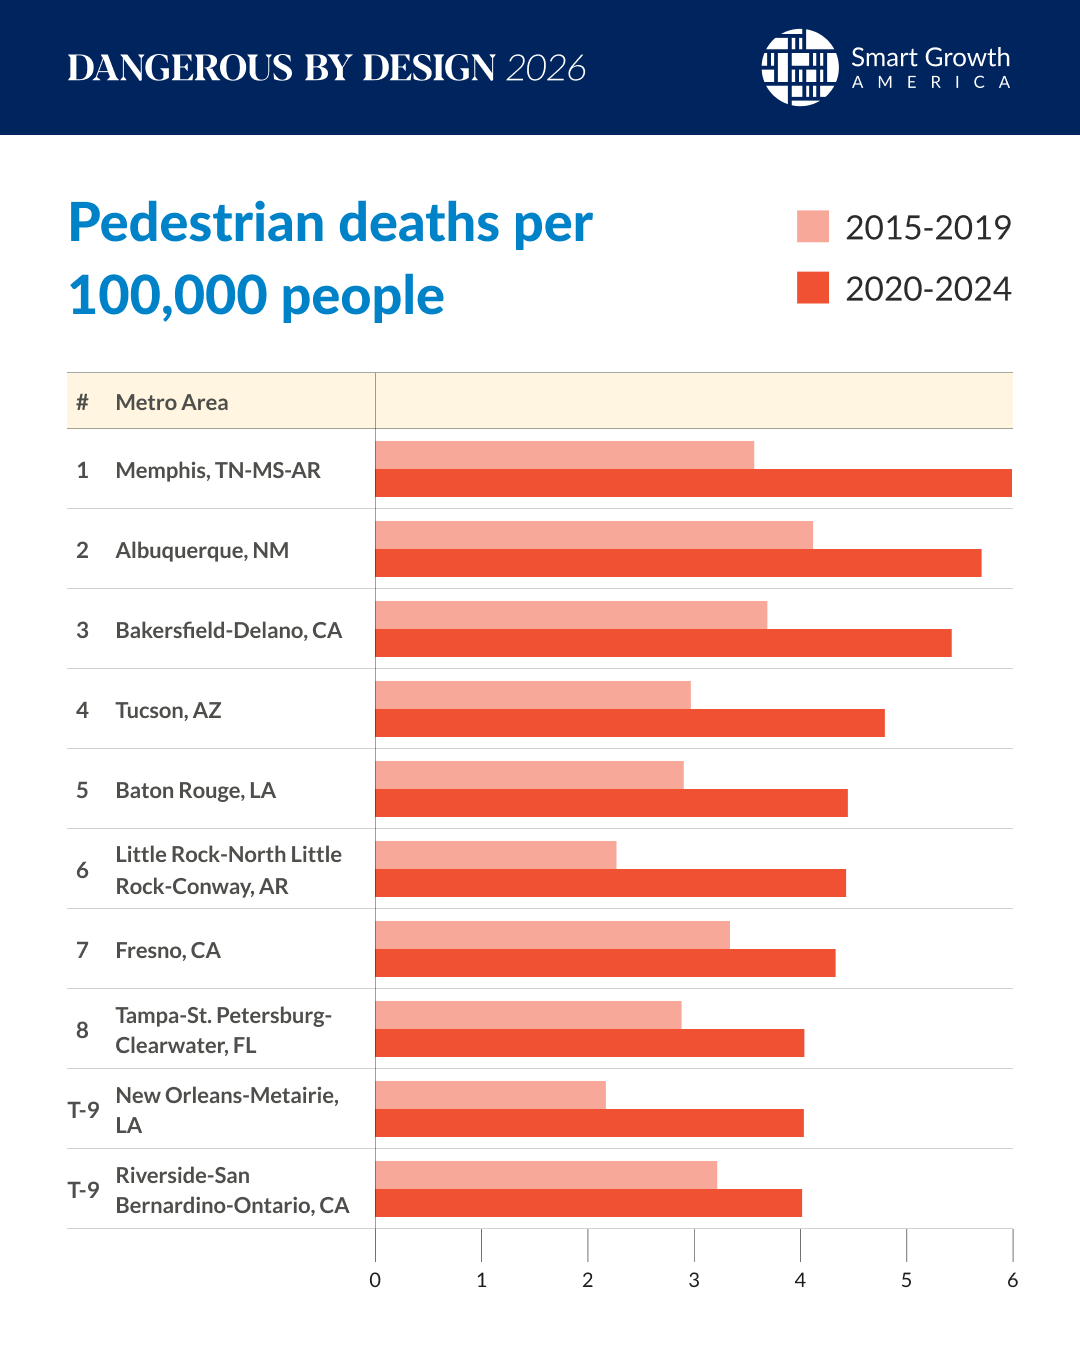
Smart Growth America, using NHTSA FARS data
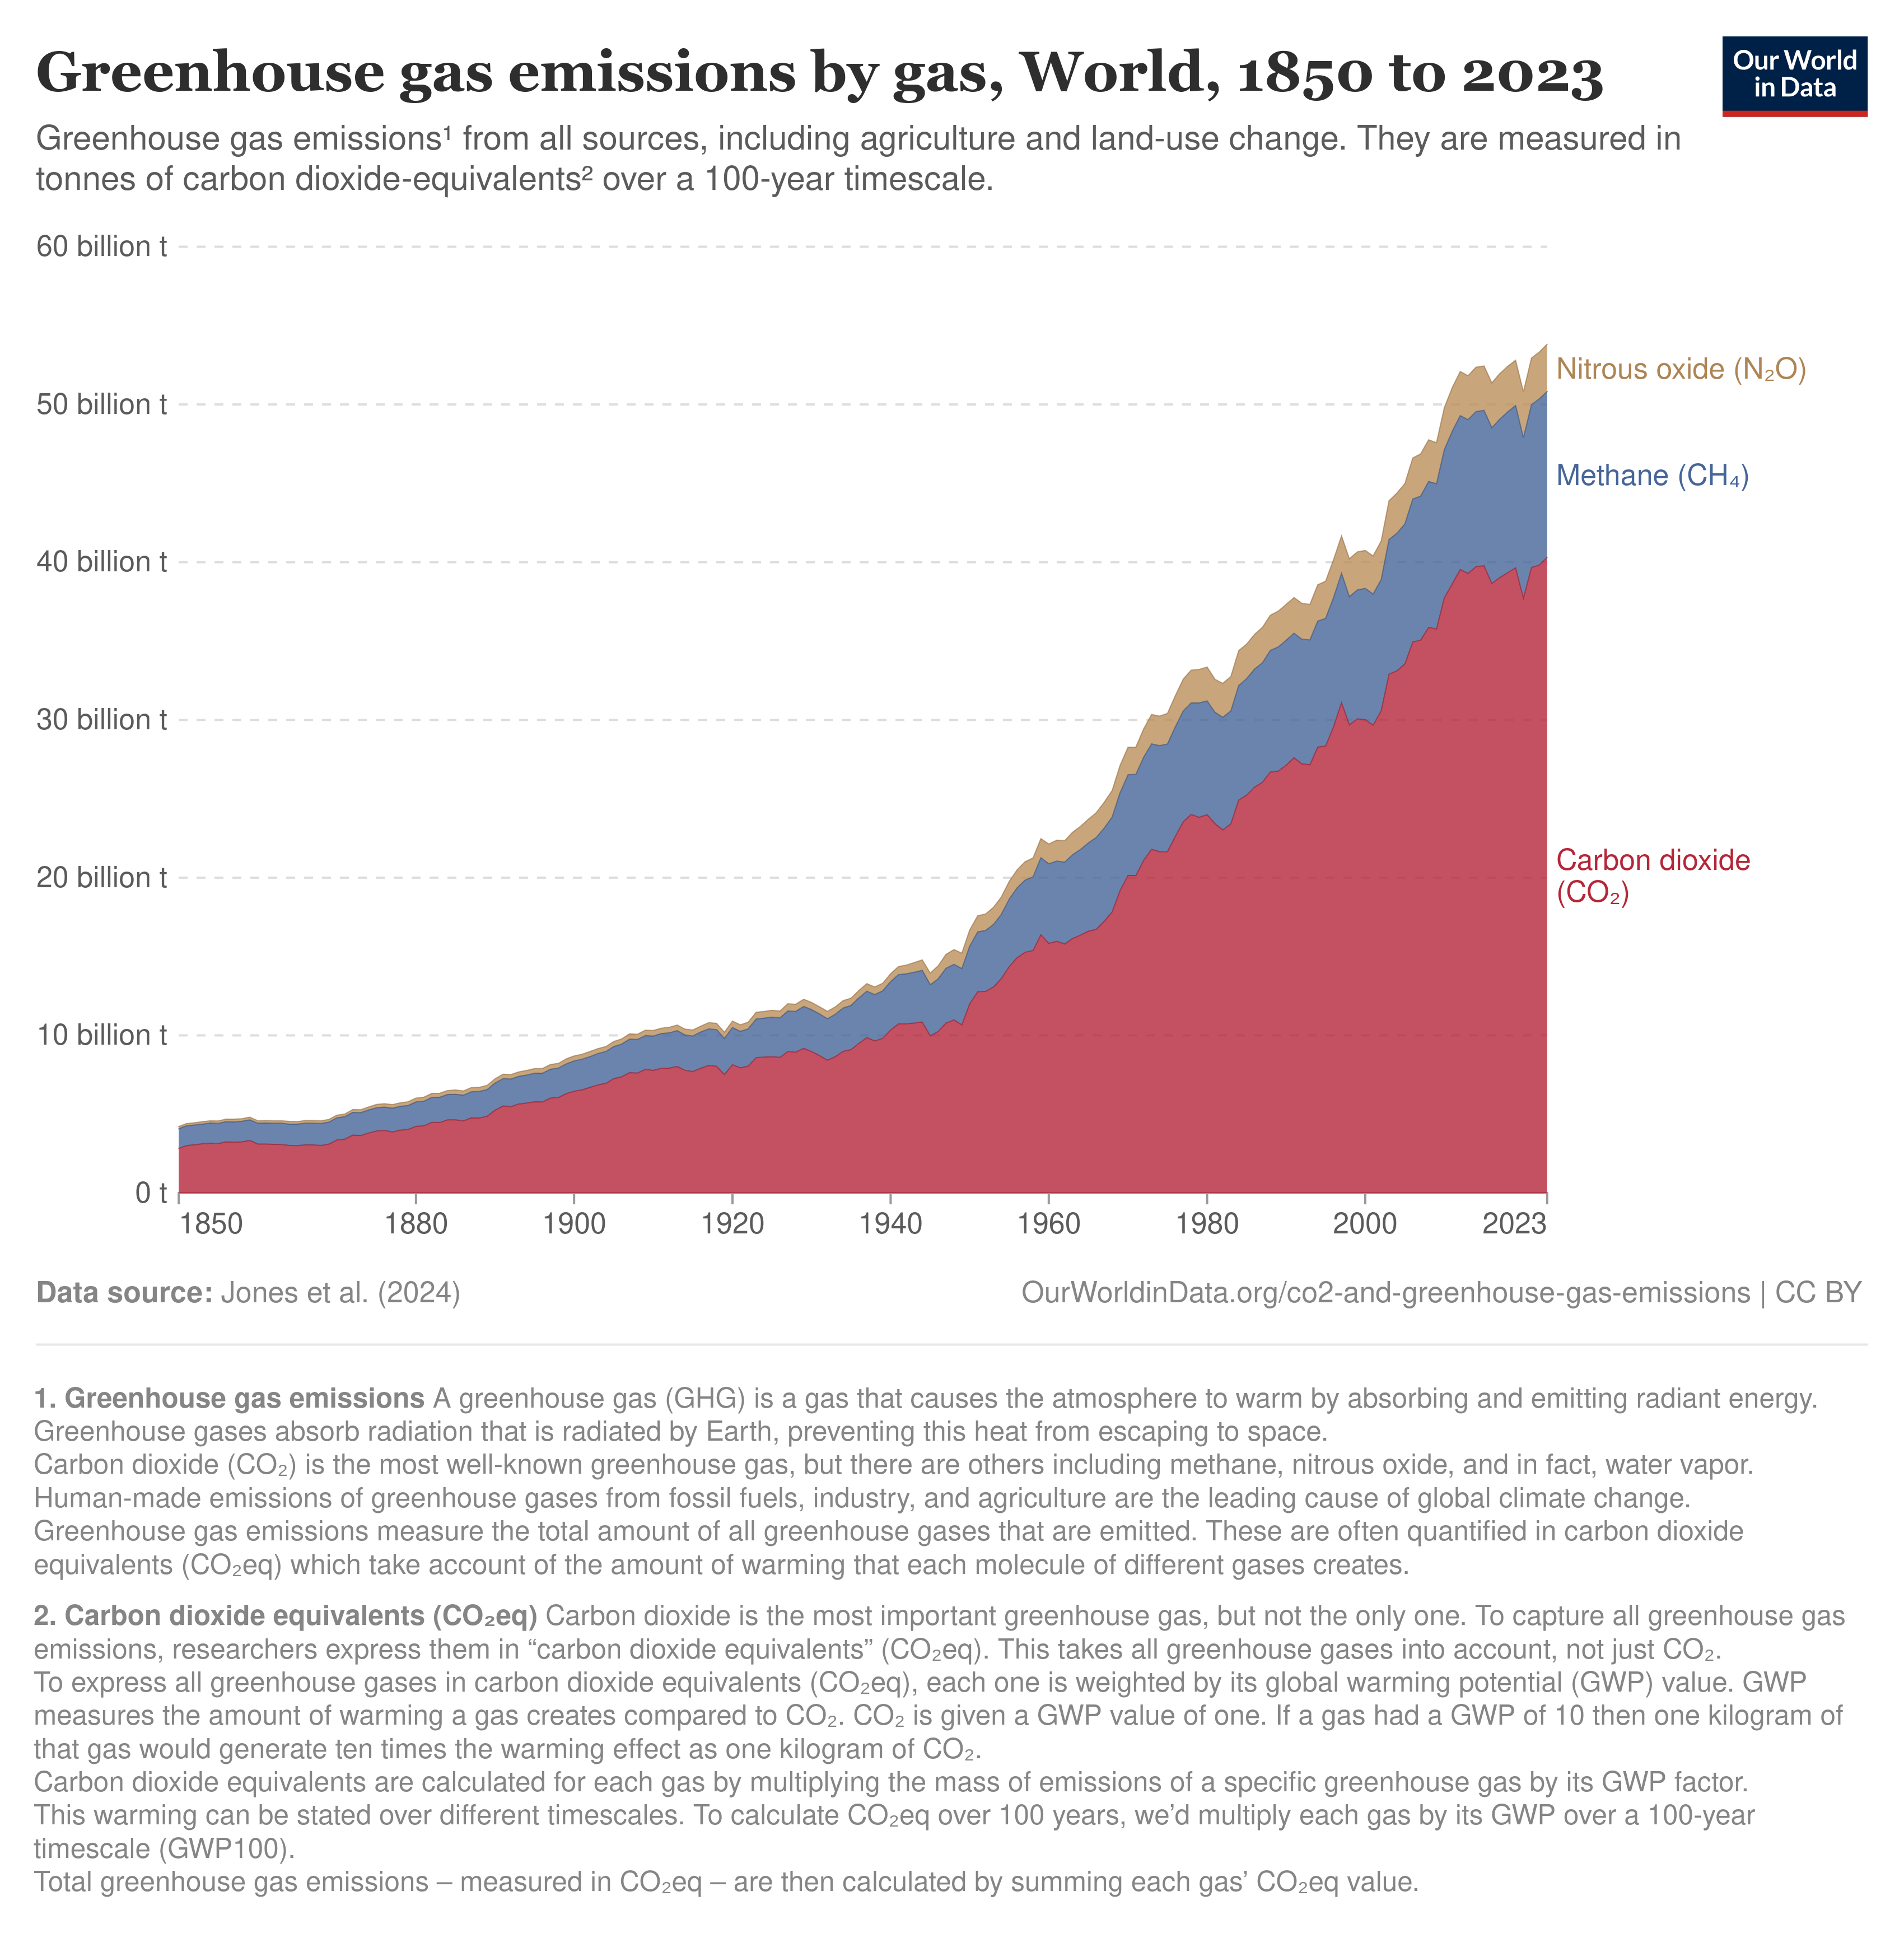
Our World in Data / Jones et al. (2024)
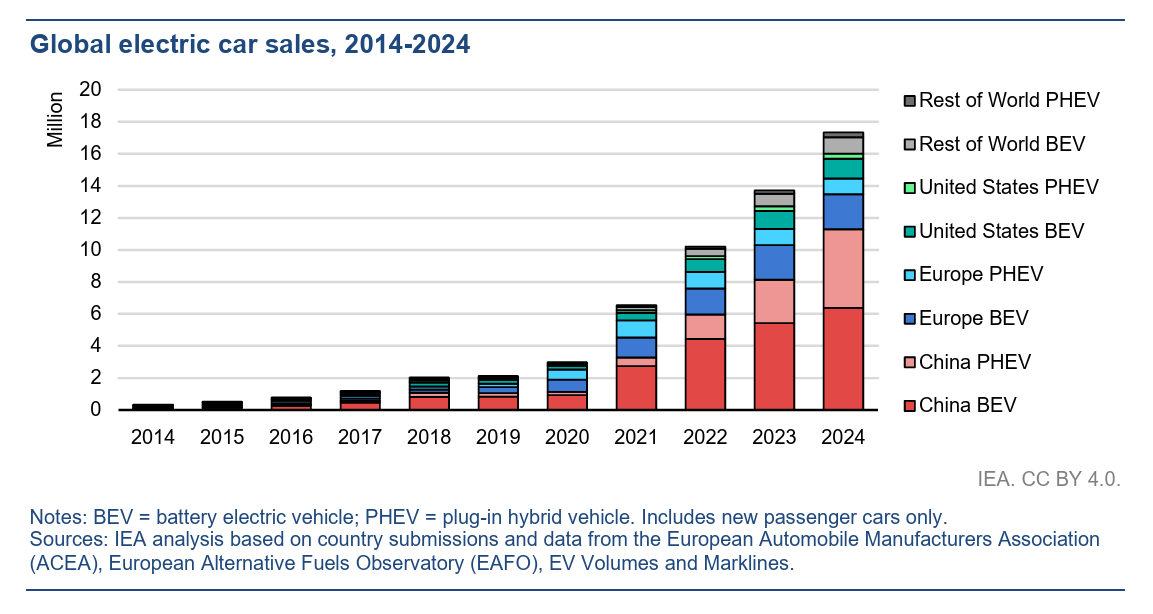
International Energy Agency
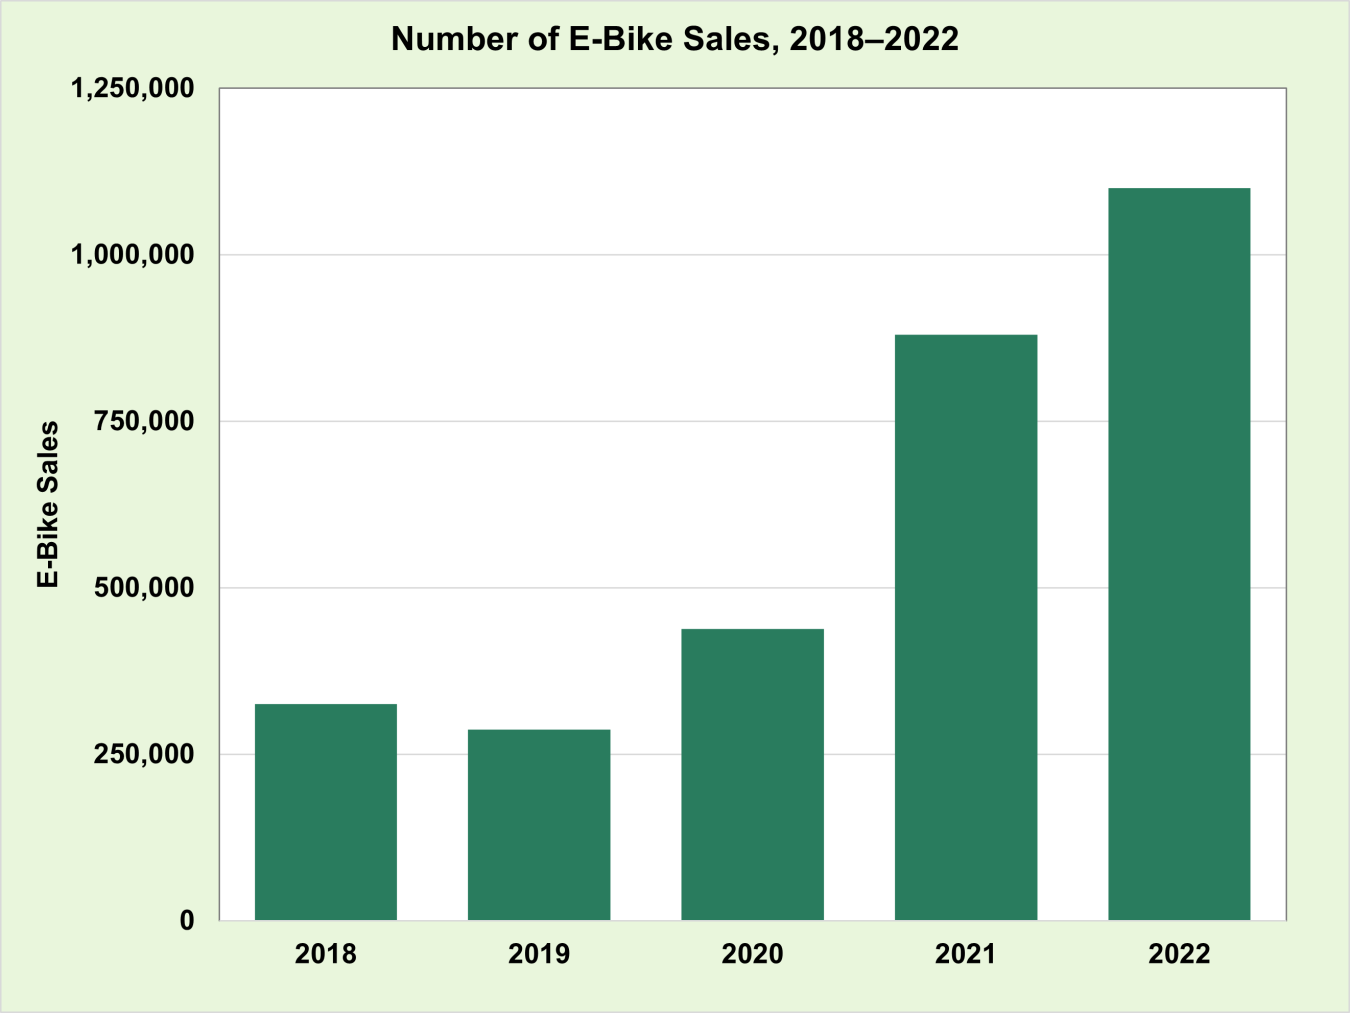
U.S. Department of Energy
Transportation policy is shaped by advocacy groups, public agencies, transit operators, automakers, fuel companies, bike and e-bike companies, mobility platforms, and charging networks.
Useful references for understanding transportation laws, street design, funding programs, and policy language.
Plans, bills, ordinances, agency guidance, Complete Streets policies, and official transportation documents.
Street-design manuals, accessibility standards, transit-priority guidance, bike-lane references, and safety frameworks.
Sources for finding policy changes, verifying official records, and tracking whether proposals passed, stalled, or changed.
Support the research, verification, writing, and maintenance needed to track transportation policies clearly. Donations can help keep the timeline updated, sourced, and useful for residents, advocates, journalists, and policymakers.
Showing 13 policies
| Level | Place affected | Policy | What it does | Status | |
|---|---|---|---|---|---|
| Federal | Nationwide | 2025 |
BUILD grant program replaces/reframes RAISE
Source: FHWA |
Reframed the federal discretionary surface transportation grant program formerly known as RAISE, shaping which local and regional infrastructure projects are prioritized for federal funding. | Implemented |
| Federal | Nationwide | 2025 |
Safe Streets and Roads for All FY2025 funding
Source: U.S. DOT |
Made federal safety funding available to local, regional, and Tribal applicants for projects and plans aimed at preventing roadway deaths and serious injuries. | Implemented |
| Federal | California | 2025 |
Federal termination of California high-speed rail funding
Source: U.S. DOT |
Terminated approximately $4 billion in unspent federal funding for California high-speed rail, escalating a major federal-state conflict over intercity rail investment. | Withdrawn |
| Federal | Nationwide | 2025 |
DOT removes Biden-era DEI and climate grant requirements
Source: U.S. DOT |
Removed Biden-era DEI and climate-related requirements from federal transportation funding compliance, changing how some grant recipients justify and administer projects. | Implemented |
| Federal | New York City | 2025 |
U.S. DOT terminates federal approval for NYC congestion pricing
Source: U.S. DOT |
Terminated federal approval for New York City’s cordon pricing program, creating a major dispute over congestion pricing, transit funding, car access, and local transportation authority. | Delayed |
| Federal | Nationwide | 2025 |
U.S. DOT review of inherited unsigned grants
Source: U.S. DOT |
Reviewed thousands of previously announced but unobligated transportation grants, approving some while leaving others delayed, revised, or subject to cancellation. | Under review |
| Federal | Nationwide | 2025 |
Pullback of selected bike, trail, and pedestrian grants
Source: Associated Press |
Withdrew selected grants for trails, bike lanes, pedestrian-safety, and road-diet-related projects that federal officials viewed as inconsistent with road-capacity priorities. | Withdrawn |
| State | New York | 2025 |
Complete Streets funding and S1832
Source: NY Senate |
Expanded Complete Streets funding support and proposed regular updates to the state bicycle and pedestrian plan. | Proposed |
| State | California | 2024 |
SB 960
Source: California Legislature |
Requires applicable Caltrans highway projects to include walking, cycling, and transit-priority improvements. | Adopted |
| State | Illinois | 2025 |
Complete Streets law and SB 899
Source: Illinois Public Act 095-0665 Source: Illinois Senate |
Supports Complete Streets and gives communities more flexibility to design safer intersections instead of prioritizing wide truck turns. | Adopted |
| State | Texas | 2025 |
Road-narrowing restriction bill
Source: Texas Legislature |
Would have limited cities’ ability to narrow roads for wider sidewalks, bike lanes, or bus lanes. | Delayed |
| State | Arizona | 2024 |
Active Transportation Safety Action Plan
Source: ADOT |
Sets a statewide plan to reduce serious and fatal pedestrian and bicyclist crashes on the State Highway System. | Adopted |
| State | Pennsylvania | 2025 |
HB 291 and SB 824
Source: PA House Source: PA Senate |
Moves toward legalizing parking-protected bike lanes, including changes affecting state-owned roads. | Proposed |